Students received their math test scores on division some did great and some need to practice a bit more. Test scores ranged from a low score of a 40 and a highest grade of a 100. If we go in order test scores were a 30,40,40,65,65,70,70,70,70,75,75,80,80,80,80,85,85,85,85,90,90,95,95,100,100. To get the mean of the grades you will have to add all the grades and divide by 25 which will give you 76. To get the standard deviation you will have to subtract each grade by 76. if we go from least to greatest giving you 14,4,9,-1,-6,-6,9,14,-11,-36,-46,24,4,-6,-1,-36,4,4,19,24,19,-11,6,9,9 next we are going to square each number. Once we squared each number we are going to add them all together giving us a total of 7750. Now we are going to divide 7750 by the 25 tests which will give us a total of 310. After we receive the total we are going to square root it which will give us the standard deviation of 17.6 . To find the medium we will get the number in the middle which is 80. Mode is the number that repeats the most. Since theirs 3 numbers that repeat the most those would be our mode 70,80 and 85.
Mean: 76
Standard diviation: 17.6
Medium:80
Mode: 70,80,85
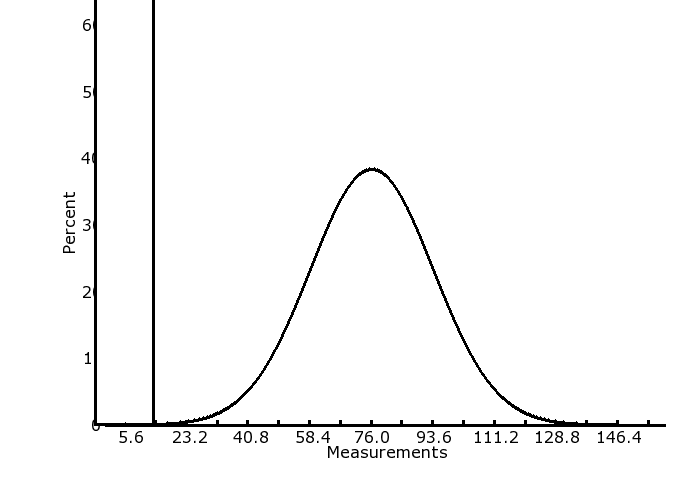
To get the first deviation we get the first two numbers next to the mean number which is 76 to find the first deviation. To find the second deviation we get 40.8 to 111.2 to be our second deviation and to find the third deviation we get the numbers that are left or the ones that are sitting under the bell curve which are 23.2 -128.4..
58.4-93.6 = 1st standard deviation 68% of all data
40.8-111.2 =2nd standard deviation 95%
23.2-128.4= 3rd deviation 99.7%